

Weekly Market Commentary August 17, 2026
LPL Research explores shifting global growth leadership, cooling emerging markets, Fed policy expectations, and foreign demand for U.S. Treasuries.

Last Edited by: LPL Research
Last Updated: August 17, 2026
Shifting Leadership in Global Growth
Talking Points
• Global growth is stabilizing, but leadership has shifted back to developed markets. The U.S. and parts of Europe are driving the latest improvement in business activity, while several large emerging markets have lost momentum after a strong start to the year.
• BRICS economies are mixed as India outpaces the others. China's growth has slowed substantially; Brazil has slipped back into contraction territory, and Russia remains weak, leaving India as the strongest major emerging-market performer despite some moderation.
• Markets have dramatically re-priced Federal Reserve (Fed) expectations. Soft July payroll growth and cooling inflation shifted investor sentiment from anticipating multiple Fed rate hikes to expecting an extended pause, helping fuel a rally in risk assets and new highs for the S&P 500.
• Foreign demand remains critical to financing U.S. debt. Japan, the United Kingdom, and China remain among the largest holders of Treasury securities, underscoring the importance of maintaining fiscal credibility and deep market liquidity to keep global investors committed to U.S. government debt.
Introduction
Global business activity is showing signs of stabilization, but beneath the surface, the world economy remains divided. Growth momentum has improved in several major developed economies, led by a stronger U.S. expansion and a tentative recovery in parts of Europe, while activity across several large emerging markets has cooled from the rapid pace seen earlier this year. Against this backdrop, investors must also contend with lingering vulnerabilities in the global financial system, including Japan's outsized role as one of the largest foreign holders of U.S. Treasury securities, a reminder that shifts in monetary policy or investor behavior abroad can have far-reaching consequences.
Mapping the Geography of Capital
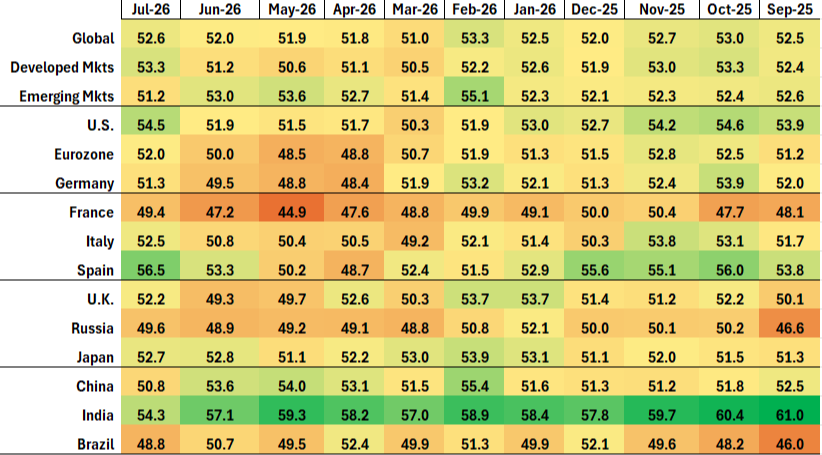
The latest Purchasing Managers’ Index (PMI) readings suggest the global economy is finding firmer footing, but the improvement is being led mostly by the developed world plus India. As noted in the global PMI table, the global composite PMI rose to 52.6 in July from 51.0 in March, extending a steady rebound after a soft patch earlier this year. Developed-market activity has strengthened even more noticeably, with the composite index climbing to 53.3 in July from 50.5 in March. The U.S. has been a major driver of that upswing, with its PMI jumping to 54.5 from 50.3 over the same period. The Eurozone has also moved back into expansion territory, rising to 52.0 in July from 50.7 in March, while Germany's index rebounded to its first expansionary reading in several months. After much of the past year was marked by concerns over sluggish growth in advanced economies, the latest data point to a broadening, if still uneven, recovery.
Global Composite Purchasing Managers’ Index (PMI)
Source: LPL Research, S&P Global 08/17/26
Disclosures: All indexes are unmanaged and cannot be invested in directly. Past performance is no guarantee of future results.
By contrast, momentum across Brazil, Russia, India, China, and South Africa (BRICS) emerging economies has cooled from the strong pace seen at the start of the year. India's composite PMI remains the highest among emerging markets at 54.3, but that marks a notable slowdown from readings above 59.0 in late 2025 and early 2026. China's index has drifted lower as well, easing from 55.4 in February to 50.8 in July, barely above the threshold separating expansion from contraction. Brazil slipped back below 50.0 in July, while Russia has remained in contraction territory for most of the past five months. The result is a striking reversal from earlier in the year, when emerging markets appeared to be carrying much of the global expansion. Today, the PMI data suggest that growth leadership has shifted back toward the U.S. and parts of Europe, even as several large emerging economies struggle to regain the momentum they enjoyed just a few quarters ago.
What a Wild Ride for Rate Expectations
Just a few weeks ago, markets were pricing in several rate hikes over late 2026 and early 2027 as investors became increasingly convinced that Federal Open Market Committee Chair Kevin Warsh would maintain a highly hawkish stance. Then came the July payrolls report, followed by the July inflation report.
Private payrolls increased by just 30,000 in July, well below the previous 12-month average gain of 119,000, while the Consumer Price Index (CPI) report showed broad-based disinflation across most categories. Considering these developments, the Fed's most likely next move is to keep the federal funds rate unchanged within its current target range of 3.50–3.75%.
As expectations for additional immediate-term rate hikes receded, risk appetite improved, helping push the S&P 500 to new highs.
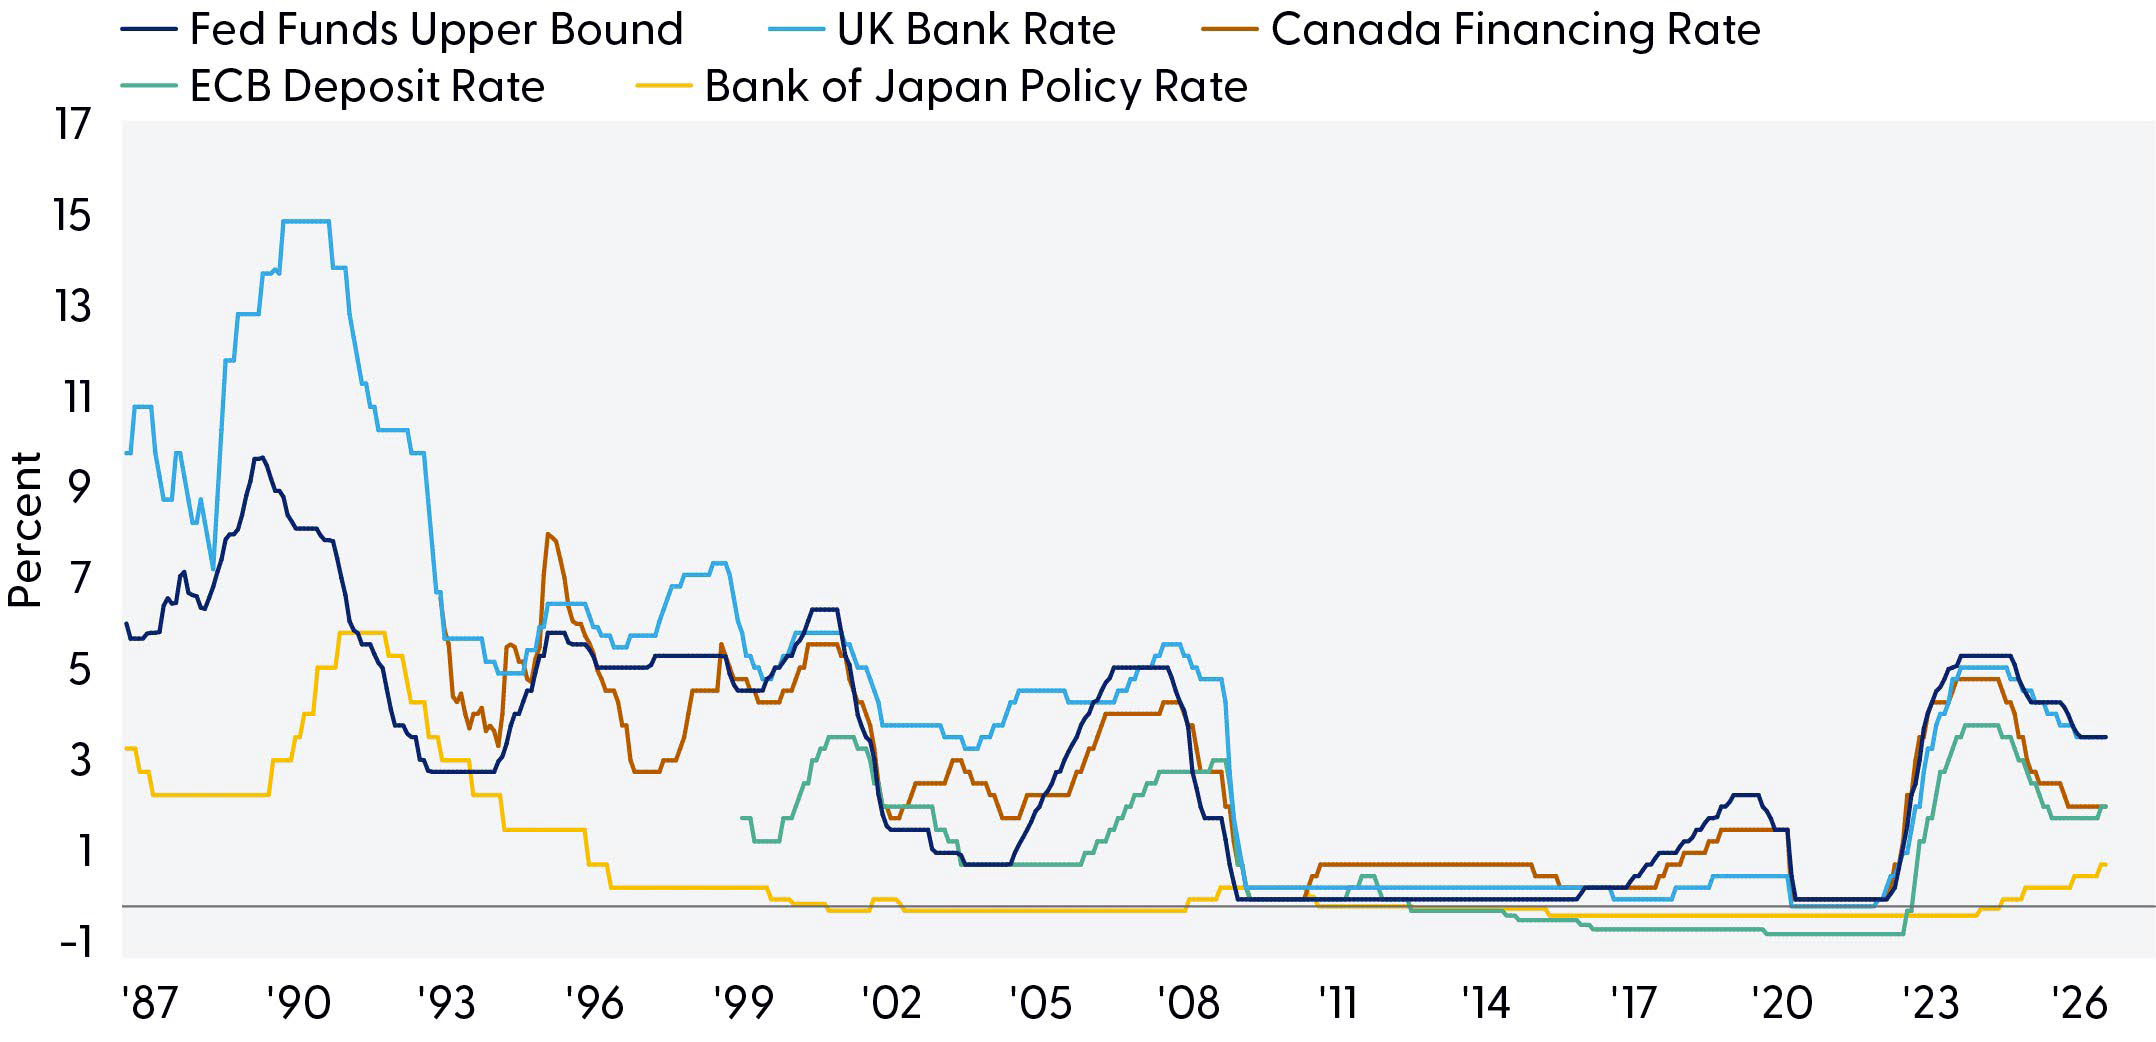
Global Policy Rates Are Converging
Source: LPL Research, Bank of Canada, Bank of England, European Central Bank Federal Reserve Board 08/17/26
Disclosures: Past performance is no guarantee of future results.
If global policy rates begin to converge over the near term, the result would likely be a narrowing of interest rate differentials that have been a major driver of currency trends and capital flows since the pandemic. As the spread between U.S., European, Canadian, U.K., and Japanese rates compresses, investors may place less emphasis on yield arbitrage and more emphasis on relative growth, productivity, and fiscal fundamentals. For global markets, convergence would likely reduce currency volatility, dampen some of the outsized cross-border bond flows that have favored higher-yielding markets, and support a more stable backdrop for risk assets. Historically, periods of monetary convergence have coincided with lower foreign exchange rate (FX) volatility and a reduced incentive for large carry trades.
The Yen Carry Trade
The yen is perhaps the most important wild card in this convergence story. Japan's historic interventions bought time, but interventions rarely create a sustained currency trend unless supported by underlying fundamentals. The yen's ability to hold gains will ultimately depend less on whether the Bank of Japan can continue normalizing policy while rate cuts elsewhere gradually narrow the gap that encouraged decades of yen-funded carry trades. If the rest of the world eases toward Japan rather than Japan tightening aggressively toward the rest of the world, the yen could strengthen in a more durable fashion. Conversely, if global yields remain structurally higher than Japanese yields, investors may once again seek yen funding, putting renewed downward pressure on the currency.
From a capital-flow perspective, convergence has the potential to reverse some of the post-pandemic allocation trends. When rate differentials were widening, capital naturally gravitated toward the highest-yielding sovereign debt markets, particularly the U.S. As those differentials narrow, the incentive to hedge foreign currency exposure declines and large institutional investors, including Japanese pension funds and insurers, may become more willing to repatriate funds or diversify holdings across regions. Such a shift would reduce the dominance of yield-seeking flows and potentially support a greater balance in global capital allocation, while also lowering the risk of sudden disruptions associated with an unwind of the yen carry trade. The key implication for markets is that a world of converging policy rates is likely one of less currency-driven volatility but a greater focus on underlying economic fundamentals and relative growth prospects.
Keeping U.S. Debt Attractive to Foreigners
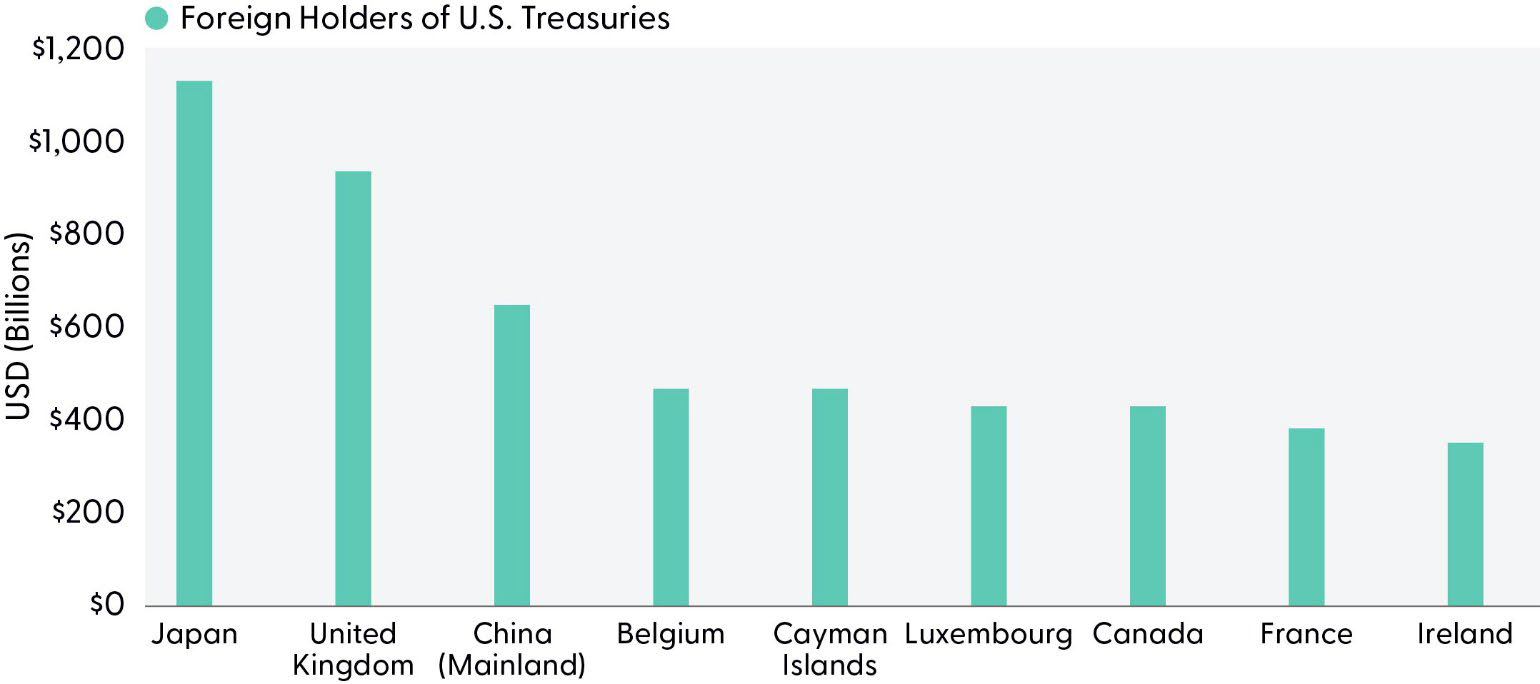
Foreign ownership of U.S. Treasury securities remains remarkably concentrated among a handful of major economies. Japan remains the largest foreign holder, with more than $1.1 trillion in Treasuries, followed by the United Kingdom at roughly $950 billion, and China at about $650 billion. Beyond those traditional creditors, financial hubs, such as Belgium, the Cayman Islands, and Luxembourg, punch far above their economic weight, reflecting the role of global custodians, reserve managers, hedge funds, and multi-national investors that use those jurisdictions as booking centers.
The theme is clear: America's borrowing costs are influenced not only by domestic investors but also by the portfolio decisions of foreign governments, pension funds, insurers, and asset managers around the world. That reality places a premium on policy credibility. For Treasury Secretary Scott Bessent, attracting foreign demand means maintaining confidence in the fiscal outlook and preserving the unrivaled liquidity of the Treasury market. For Fed Chair Kevin Warsh, it means reinforcing the Fed's inflation-fighting credibility and ensuring that real yields remain attractive relative to competing sovereign debt markets. Together, credible fiscal stewardship and stable monetary policy can help keep global capital flowing into Treasuries, even as other major central banks adjust course.
Japan is the Largest Foreign Holder of U.S. Treasury Securities
Source: LPL Research, U.S. Treasury 08/12/26
Disclosures: Past performance is no guarantee of future results.
Concluding Remarks
The global economy is stabilizing, but the sources of growth are changing. The U.S. remains the primary engine of expansion among developed economies, while Europe is beginning to regain its footing. Meanwhile, several major emerging markets have lost momentum. China's growth has cooled; Brazil has slipped back into contraction territory, and Russia remains weak, leaving India as the strongest major emerging-market performer despite moderating from the rapid pace seen earlier in the cycle. Markets have also sharply revised expectations for Fed policy. Soft July payroll growth and easing inflation have shifted investor sentiment from anticipating additional rate hikes to expecting an extended pause, helping fuel stronger risk appetite and new highs in the S&P 500. For further talking points and charts, check out the August Economic Navigator “Show Me the Money. We'll Deflate It Later.”
The next phase of the cycle may be shaped less by economic growth and more by the geography of capital. As central-bank policies gradually converge, narrowing interest rate differentials could reduce the importance of yield-chasing and place greater emphasis on growth prospects, productivity, and fiscal credibility. That makes foreign demand for U.S. assets increasingly important. Japan, the United Kingdom, and China remain among the largest holders of Treasury securities, underscoring how U.S. borrowing costs are influenced by investment decisions made abroad. Maintaining fiscal discipline, deep market liquidity, and attractive real yields will be critical to ensure that global capital continues to view Treasury securities as the world's preferred safe-haven asset.
Asset Allocation Insights
LPL’s Strategic and Tactical Asset Allocation Committee (STAAC) maintains its recommendation for a tactical equity overweight and fixed income underweight. We believe an improving macro backdrop and sustained AI-driven earnings growth will continue to support the broader equity market through the remainder of 2026. The Committee maintains a moderate equity overweight and recently shifted the implementation of this view from low-volatility strategies to a quality-factor tilt given the improving technical analysis picture following the recent breakout to new highs. Within fixed income, we continue to emphasize high-quality bonds, take a cautious stance toward rate-sensitive sectors, and maintain exposure to diversifying and alternative strategies. Within bond sectors, we remain underweight investment grade corporates and mortgage-backed securities (MBS) as spreads remain tight relative to historical standards, diminishing the risk/reward profile of the sectors.
Jeffrey Roach, PhD, Chief Economist, LPL Financial
Important Disclosures
This material is for general information only and is not intended to provide specific advice or recommendations for any individual. There is no assurance that the views or strategies discussed are suitable for all investors or will yield positive outcomes. Investing involves risks including possible loss of principal. Any economic forecasts set forth may not develop as predicted and are subject to change.
References to markets, asset classes, and sectors are generally regarding the corresponding market index. Indexes are unmanaged statistical composites and cannot be invested into directly. Index performance is not indicative of the performance of any investment and do not reflect fees, expenses, or sales charges. All performance referenced is historical and is no guarantee of future results.
Any company names noted herein are for educational purposes only and not an indication of trading intent or a solicitation of their products or services. LPL Financial doesn’t provide research on individual equities.
All information is believed to be from reliable sources; however, LPL Financial makes no representation as to its completeness or accuracy.
All investing involves risk, including possible loss of principal.
US Treasuries may be considered “safe haven” investments but do carry some degree of risk including interest rate, credit, and market risk. Bonds are subject to market and interest rate risk if sold prior to maturity. Bond values will decline as interest rates rise and bonds are subject to availability and change in price.
The Standard & Poor’s 500 Index (S&P500) is a capitalization-weighted index of 500 stocks designed to measure performance of the broad domestic economy through changes in the aggregate market value of 500 stocks representing all major industries.
The PE ratio (price-to-earnings ratio) is a measure of the price paid for a share relative to the annual net income or profit earned by the firm per share. It is a financial ratio used for valuation: a higher PE ratio means that investors are paying more for each unit of net income, so the stock is more expensive compared to one with lower PE ratio.
Earnings per share (EPS) is the portion of a company’s profit allocated to each outstanding share of common stock. EPS serves as an indicator of a company’s profitability. Earnings per share is generally considered to be the single most important variable in determining a share’s price. It is also a major component used to calculate the price-to-earnings valuation ratio.
All index data from FactSet or Bloomberg.
This research material has been prepared by LPL Financial LLC.
Not Insured by FDIC/NCUA or Any Other Government Agency | Not Bank/Credit Union Guaranteed | Not Bank/Credit Union Deposits or Obligations | May Lose Value
RES-0007122-0526 Tracking #1159408 | #1159409 (Exp. 08/27)